Benchmark Analysis of KAIST & Seoul National University: in the fields of Machine Learning and Antibody
Paige Kim
June 29, 2020
In the past decade, there have been numerous rising technology fields that have changed or started to change people’s lives and the society. For example, Machine Learning & Artificial Intelligence have gone far beyond the original computer & IT scope, applied in the manufacturing industry as Industry 4.0 and the automobile industry as autonomous driving. Also, the boom of Biopharma has shown tangible results in treating various diseases, such as certain monoclonal antibodies that are found effective for the treatment of cancer. Nevertheless, for researchers and research managers in academia, it is critical to sense the front-line of rising technology fields and to objectively benchmark against the global leaders. Thus, in this article we conduct patent analysis of two top Korean universities: Korea Advanced Institute of Science and Technology (KAIST) and Seoul National University, benchmarking them over the global research leaders in the two selected fields including Machine Learning and Antibody. The patent analysis in this article is powered by LexisNexis® PatentSight®, and data of the patent analysis herein is as of April 20, 2020.
1. A brief overview
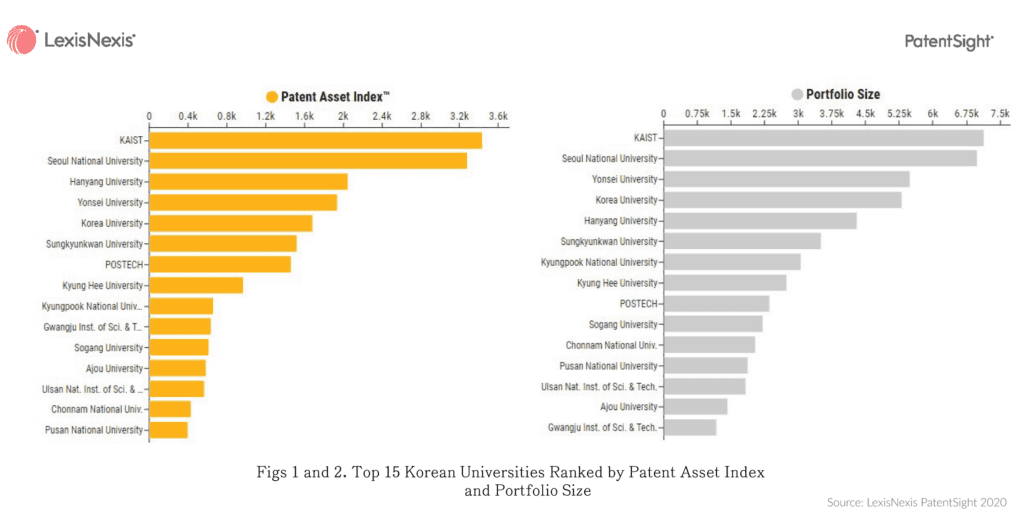
First of all, this article chose KAIST and Seoul National University for the benchmark analysis because they are the absolute #1 and #2 in Korean academia in terms of research capabilities and strengths. Figures 1 and 2 show the top 15 Korean universities ranked by Patent Asset Index (PAI) and Portfolio Size, respectively. In both rankings, KAIST is the #1 and Seoul National University is the #2.
The Patent Asset Index as utilized in the first ranking is a metric of a patent portfolio defined as the aggregate strength of all the patents the portfolio contains. The strength of each individual patent is measured by its Competitive Impact (CI). The Competitive Impact consists of two dimensions: Technology Relevance (TR) and Market Coverage (MC), indicating the technological Impact and market potential of a patent, respectively.
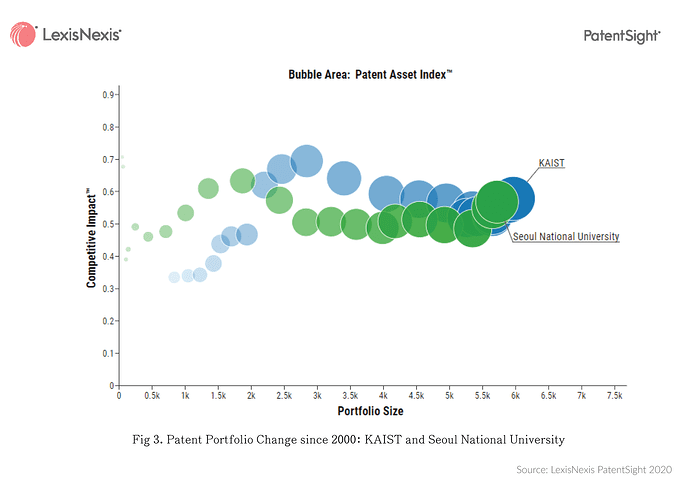
With the brief overview, we look at the patent portfolio change of KAIST and Seoul National University since 2000, as shown in Figure 3. X-axis represents portfolio size, Y-axis represents Competitive Impact namely the average quality of the portfolio, and the bubble size indicates the Patent Asset Index of the portfolio. Both universities show similar portfolio development patterns over the past 20 years: increasing quantity substantially while maintaining steady quality. Particularly, it seems both have shifted their focus from quantity increase to quality growth in the past 3 years.
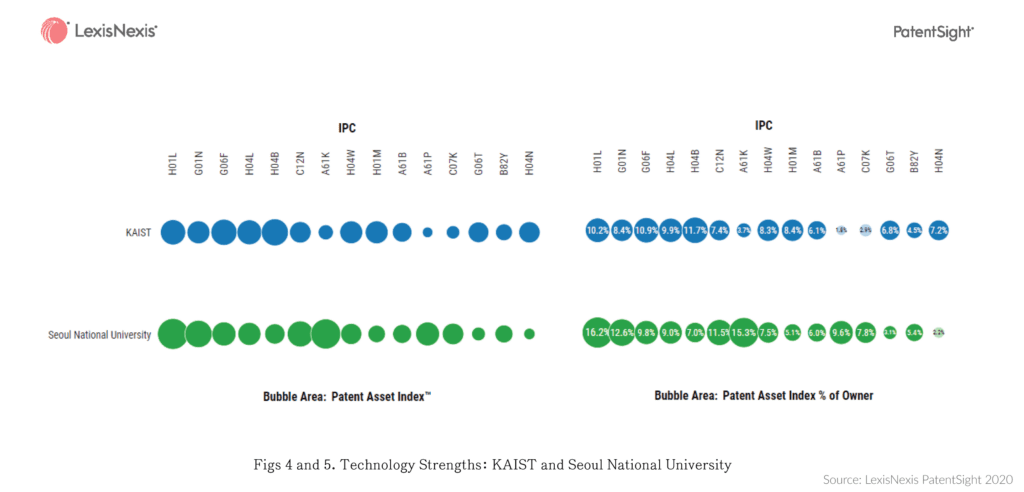
Shown in Figures 4 and 5 are two matrix charts about technology strengths of KAIST and Seoul National University across their top IPC fields (IPC level 3). In Figure 4 the bubble size indicates the Patent Asset Index of the patents falling within the category, while in Figure 5 that indicates the Patent Asset Index % of the patents in the category in view of the own’s overall Patent Asset Index. That is to say, if an IPC field has sizable bubbles in both charts, then this field is definitely a technology strength and focus of the university. As we can see, KAIST and Seoul National University share common focus areas including Semiconductor (H01L) and Data Processing (G06F). Also, Seoul National University is quite strong in the pharma area (A61K) with 15.5% of its overall Patent Asset Index allocated in this field.
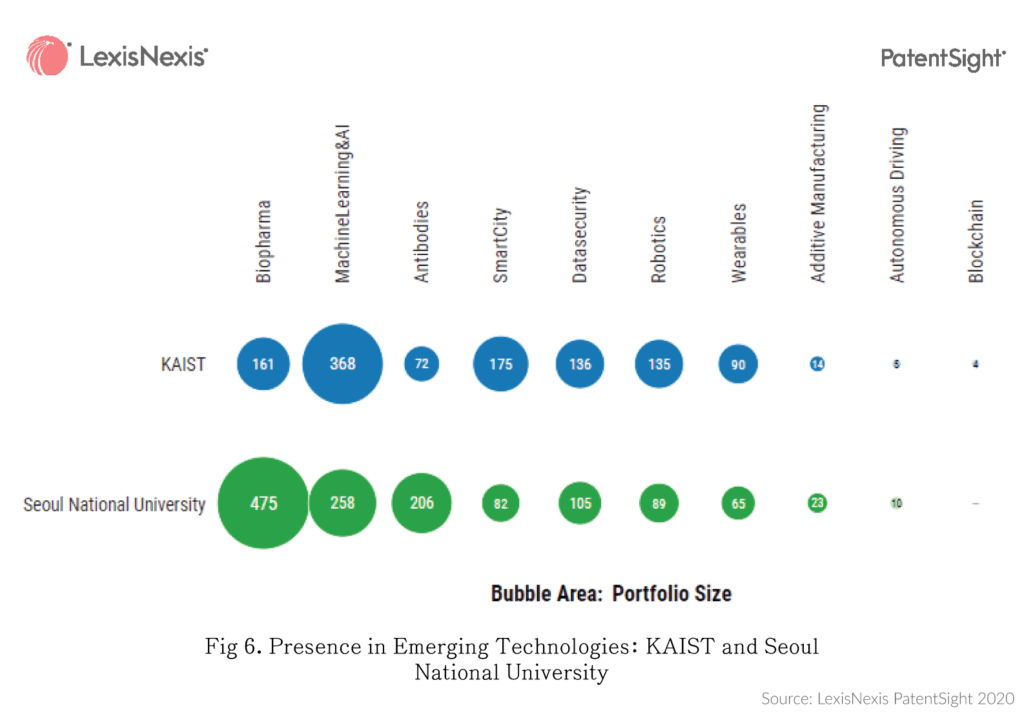
Then we look at the presence of KAIST and Seoul National University in certain emerging technologies, as shown in Figure 6. PatentSight has collaborated with Swiss Patent Office and carefully defined the patent search strategy for below technologies: Additive Manufacturing, Antibodies, Autonomous Driving, Biopharma, Blockchain, Data Security, Machine Learning & AI, Robotics, Smart City, and Wearables. Thus, we can utilize the well-defined search strategy to analyze each emerging technology and the players thereof.
In Figure 6, each bubble represents the portfolio size of the university in that particular technology field. As can be seen, both KAIST and Seoul National University have a good number of inventions in Machine Learning, while Seoul National University is also building a strong portfolio in Biopharma and Antibody.
Subsequently, we chose technology fields of Machine Learning and Antibody to conduct benchmark analysis. Specifically, in the field of Machine Learning, we benchmark KAIST and Seoul National University against two global research leaders: MIT and University of California (UC), both ranked at the top in this field in terms of Patent Asset Index. In the field of Antibody, Seoul National University is benchmarked against two global leaders: University of Pennsylvania (UPENN) and University of California (UC), both ranked at the top in this field in terms of Patent Asset Index. KAIST is not included in the Antibody analysis simply because Antibody is not a focus area of KAIST.
2. Machine learning benchmark analysis: KAIST, Seoul National University, MIT, and the University of California
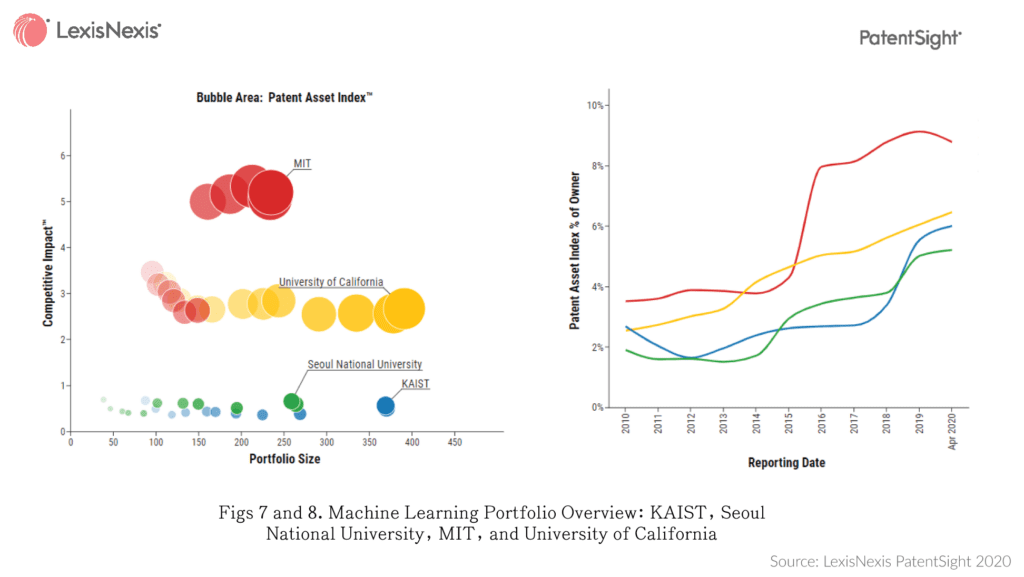
The portfolio overview of each university in the field of Machine Learning is shown in Figure 7. MIT owns the strongest portfolio (followed by University of California, KAIST, and Seoul National University) with the smallest portfolio size. Figure 8 shows the trend of Patent Asset Index % of the patents in this field in view of each university’s overall Patent Asset Index. Since 2015, Machine Learning has become increasingly important in each university’s research fields. Particularly at MIT, today it accounts for around 9% of MIT’s portfolio strength.
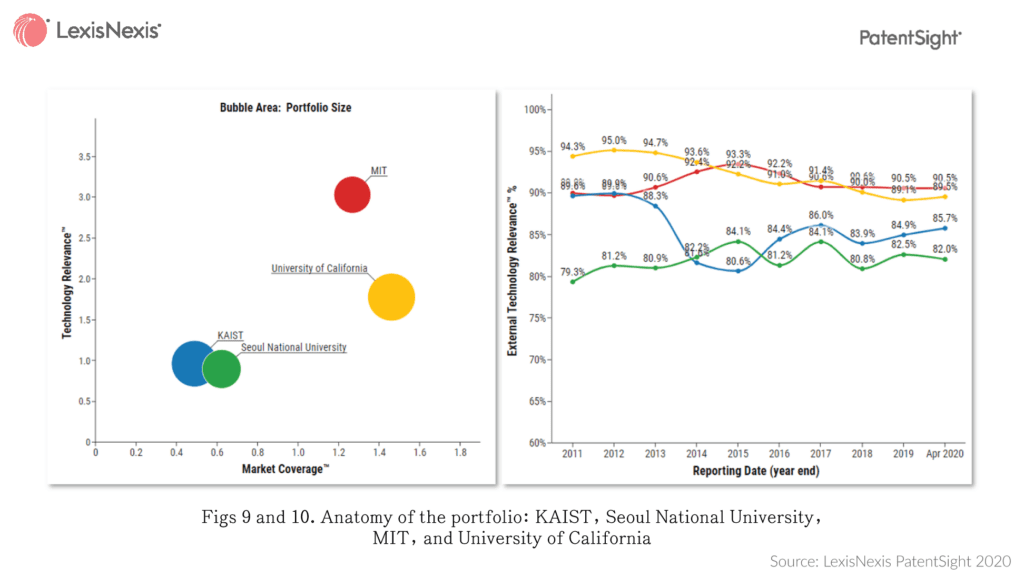
To understand what lead to a strong portfolio, we analyzed the trends of Technology Relevance and Market Coverage of each university and further down to External Technology Relevance to identify the technological Impact onto the research community. As can be seen from Figures 9 and 10, in terms of both Technology Relevance and Market Coverage, MIT and University of California are higher than KAIST and Seoul National University, while all four universities have high share of external technological Impact to others.
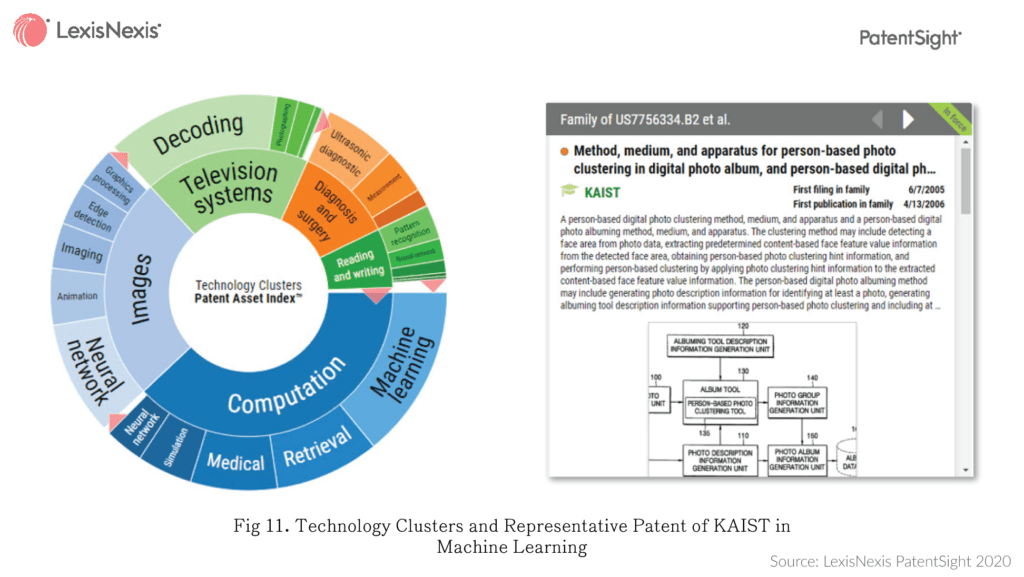
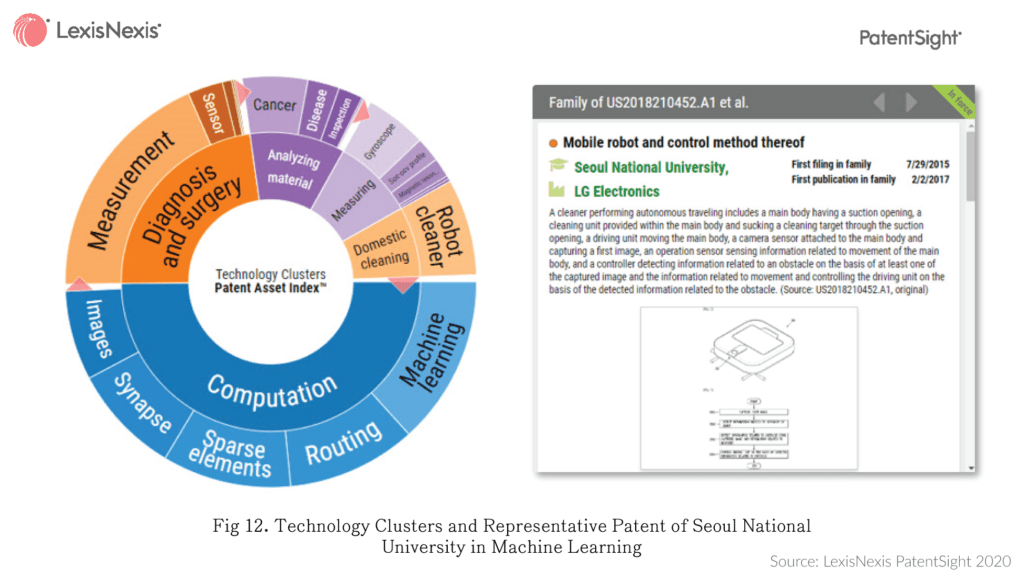
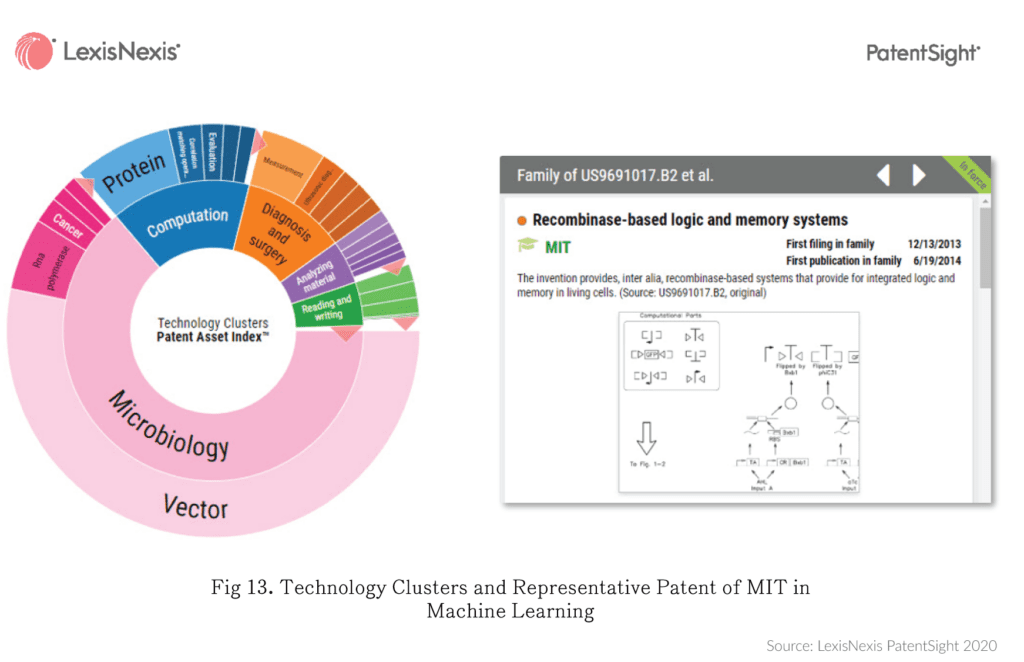
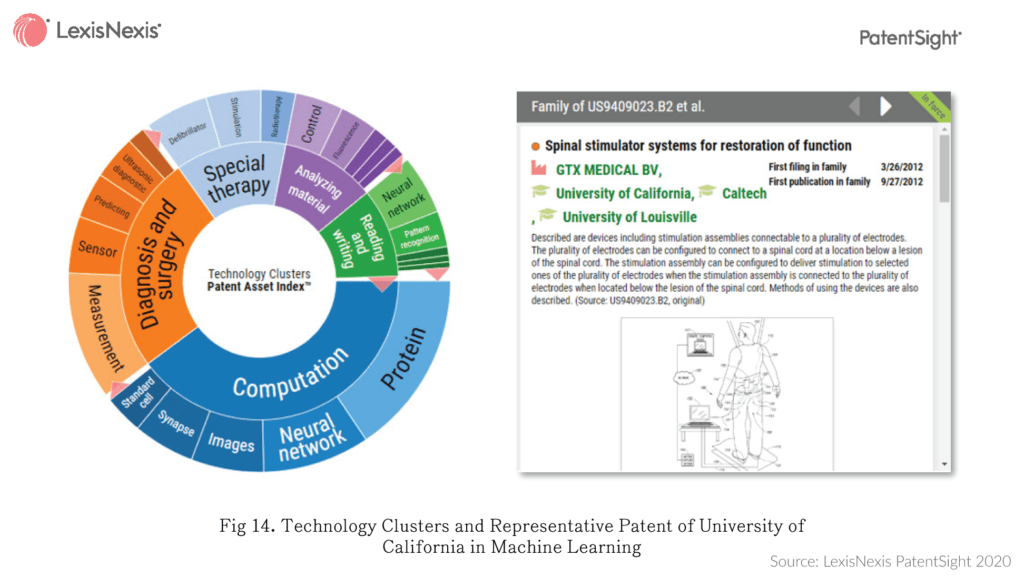
Further we generated the technology clustering charts of each university in the field of Machine Learning, as shown in Figures 11 – 14. While scanning through the charts, we can see some common application areas of Machine Learning across the four universities, for example computation, diagnosis and surgery. However, there are also areas that are notably unique to each university, in the sense that the area appears only in the chart for that one university. Such notable application areas of Machine Learning include: Image recognition and TV systems of KAIST, domestic cleaning of Seoul National University, microbiology of MIT, and special therapy of University of California. Figures 11 – 14 also list one representative patent from each notable area of each university, including an image recognition patent by KAIST, a robot cleaner patent by Seoul National University, a gene editing patent by MIT, and a defibrillator patent by University of California.
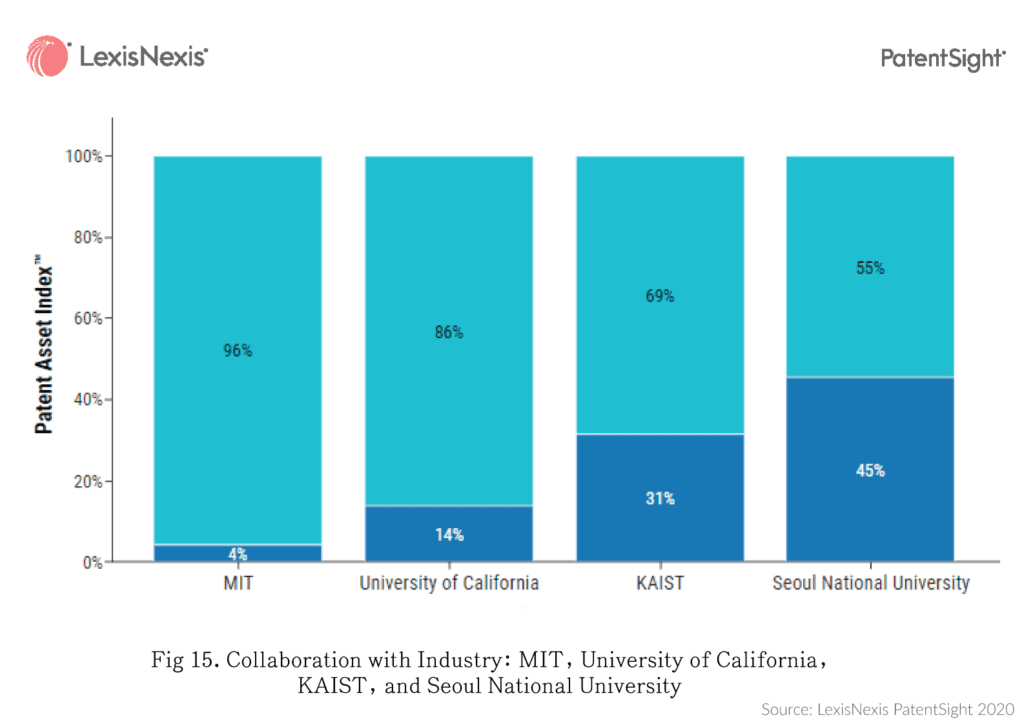
Moreover, since collaboration between academia and industry is always an interesting topic, we looked at the industry collaboration profile of the four universities. As can be seen from Figure 15, in the field of Machine Learning, Seoul National University and KAIST collaborate with industry partners more than MIT and University of California do. In particular, out of Seoul National University’s portfolio, 45% of the Patent Asset Index came from the outcome from collaboration with corporations. Light blue area shows the portfolio strength derived from researches only.
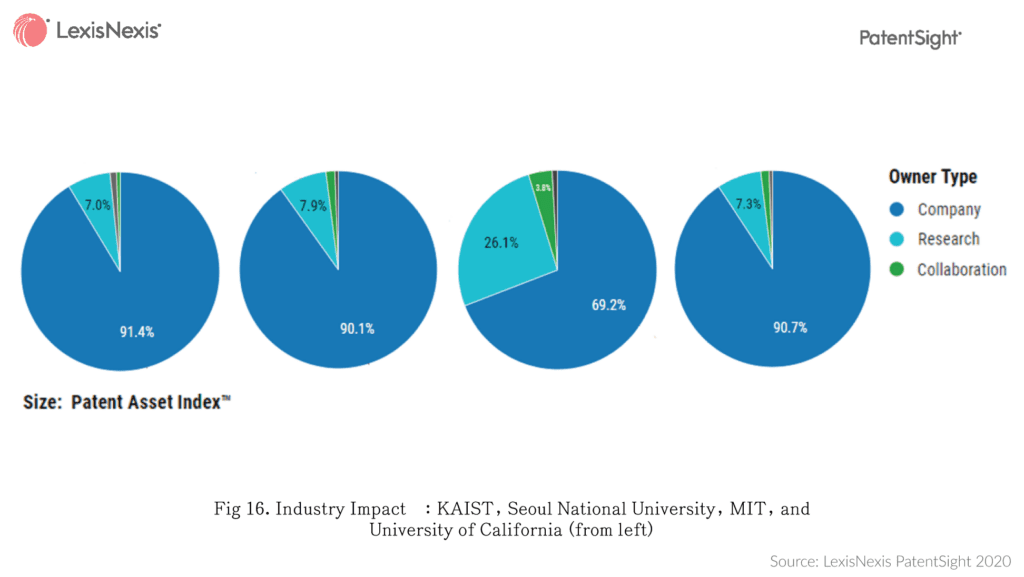
Lastly, we assessed the industry Impact each university has through forward citation analysis of their Machine Learning portfolios. Figure 16 shows the Patent Asset Index % of forward citations that came from various types of owners: corporate, research, or corporate and research collaboration. The sequence of universities in Figure 16 is KAIST, Seoul National University, MIT, and University of California. Out of the four universities, KAIST is shown the highest while steady Impact™ to corporations, namely industry.
3. Antibody benchmark analysis: Seoul National University, University of Pennsylvania, and the University of California
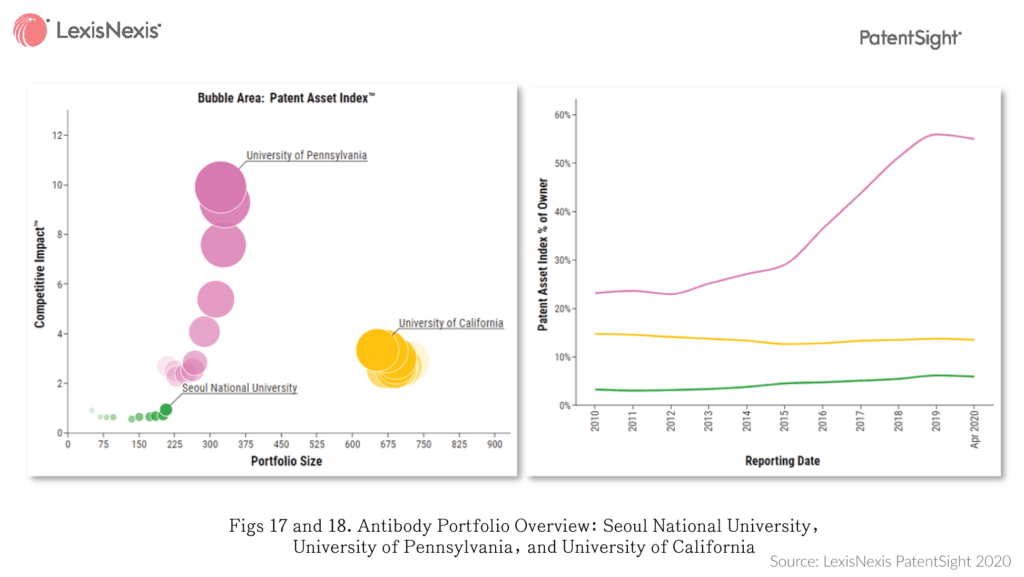
The portfolio overview of each university in the field of Antibody is shown in Figure 17. University of Pennsylvania owns the strongest portfolio, followed by University of California and Seoul National University. Also, Figure 18 indicates that since 2015 Antibody has become increasingly important in University of Pennsylvania’s portfolio, compared to its steady presence in University of California and Seoul National University.
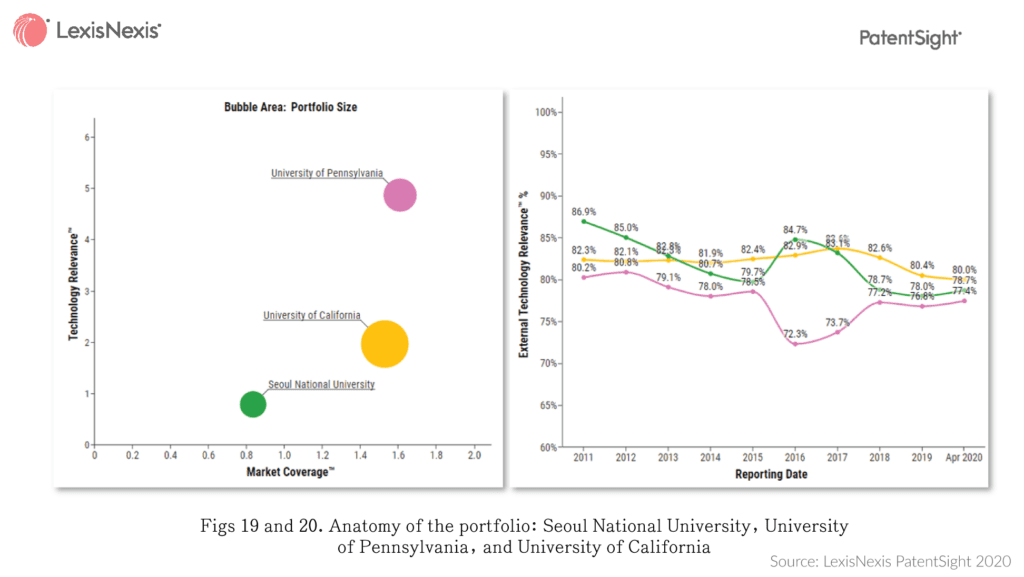
To understand what lead to a strong portfolio, we analyzed the trends of Technology Relevance, Market Coverage, and External Technology Relevance of each university. As can be seen from Figure 19, University of Pennsylvania has much higher Technology Relevance than University of California and Seoul National University, while maintaining its portfolio’s share of External Technology Relevance over 80% in the past decade generating high external research impact shown in Figure 20.
Also, we generated the technology clustering charts of each university in the field of Antibody, as shown in Figures 21 – 23. While comparing the charts, we can see notable and unique sub areas to certain universities, for example Detection and Sensing of Seoul National University and Vaccine of University of California. Nevertheless, University of Pennsylvania seems to be conducting research in all the fundamental aspects of antibody. Figures 21 – 23 also list one representative patent from each university, including a Seoul National University patent relating to nanoparticles that antibody can be functionalized to, a University of Pennsylvania patent relating to utilizing a genetically modified T call to treat cancer, and a University of California patent about vaccine.
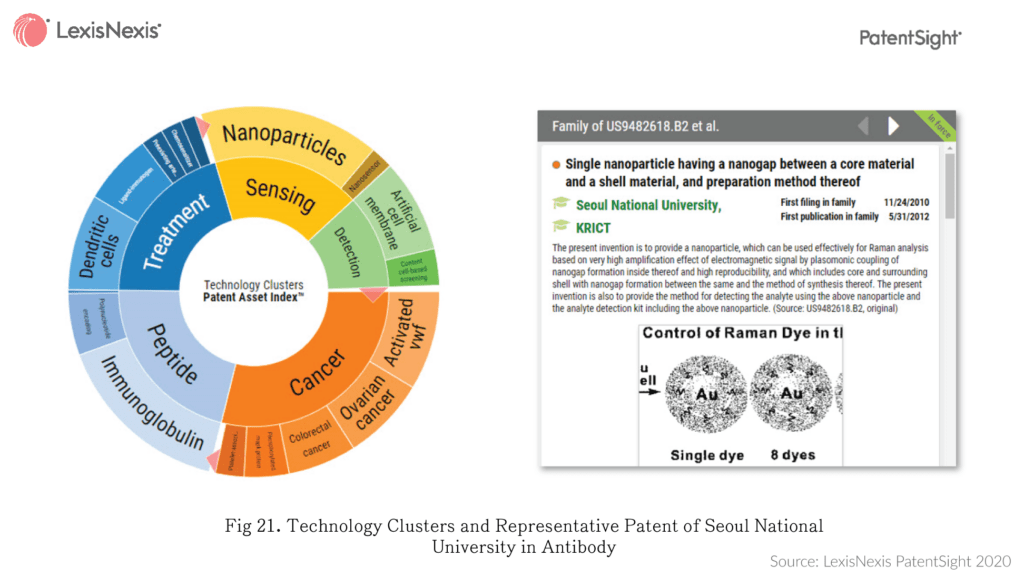
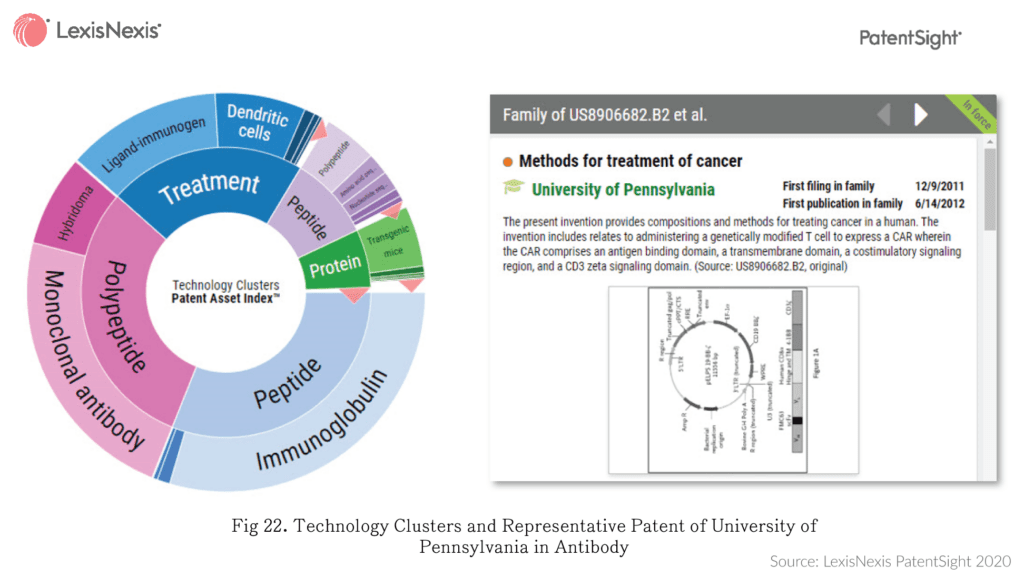
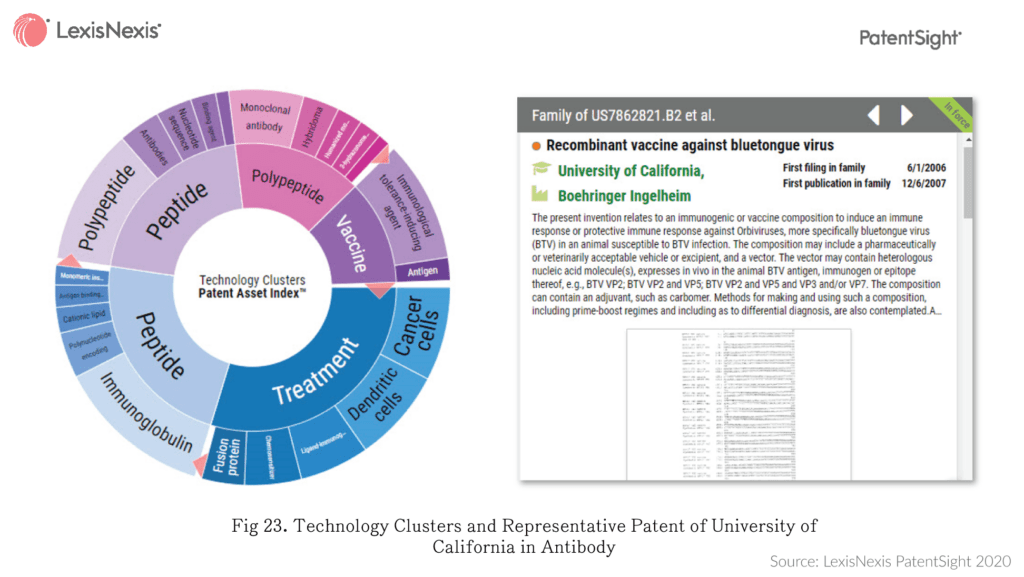
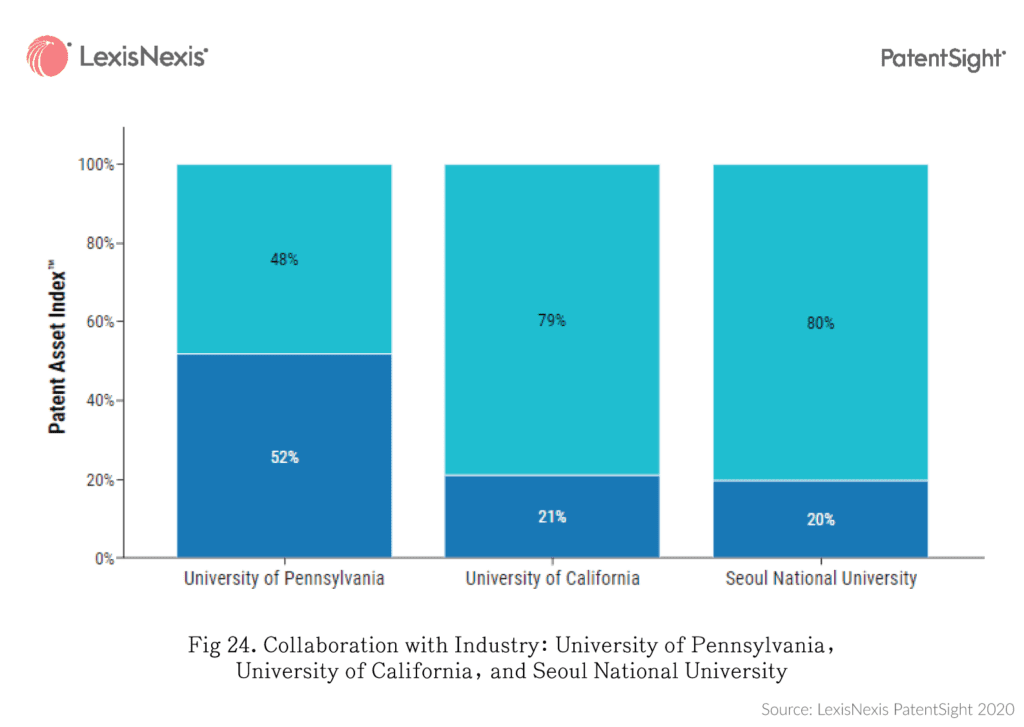
Figure 24 shows the industry collaboration profile of the three universities. In the field of Antibody, their external partners are pharma companies. We can see that, University of Pennsylvania collaborates with pharma companies more than University of California and Seoul National University do, and actually the collaboration outcomes serve as the major contribution to its high Technology Relevance. Out of University of Pennsylvania’s top 20 patents in antibodies sorted by Competitive Impact, 15 patents are co-owned by corporates. On the contrary, out of Seoul National University’s top 20 patents in antibodies, only 2 patents are co-owned by corporates.
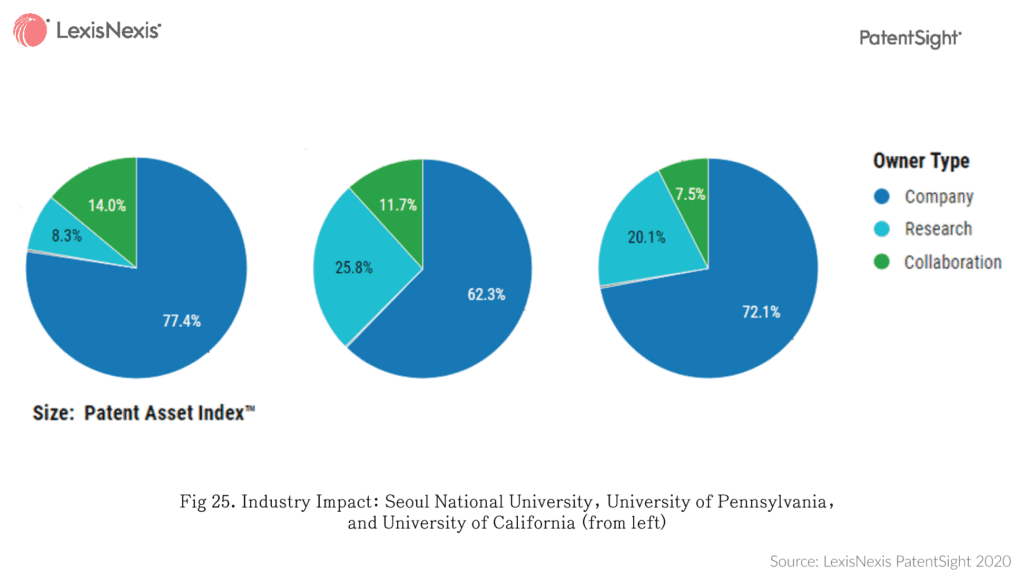
Lastly, we assessed the industry impact each university has through forward citation analysis of their Antibody portfolios. As can be seen in Figure 25, in view of the percentage of forward citations came from various types of owners, Seoul National University has the highest impact to industry, 77.4% from corporate and 14% derived from corporate and research collaboration.
See how to use the Patent Asset Index for patent portfolio benchmarking.
Learn more about PatentSight and the Patent Asset Index.
Excellent data quality is the foundation of reliable analyses. Learn how PatentSight enhances patent data here.