Win New Business With Patent Analytics

There is constant pressure on law firms to continue to develop new business—responding to a request for proposal, making proactive pitches to potential new clients, cross-selling to existing clients, expanding into new practice areas, and identifying new revenue streams—all in an increasingly competitive business environment. Patent data and analytics can play an important role in helping law firms win new business.
Firms can now quantify their patent prosecution performance using USPTO patent data and highlight their successes with favorable patent metrics to earn a prospective client’s trust to win new business and grow your footprint with existing clients. However, law firms should keep in mind when making claims to prospective clients that USPTO patent statistics can be misleading and sometimes fail to show which law firm is truly better. If Law Firm A touts its effectiveness with an 88% USPTO allowance rate, and Law Firm B touts its efficiency because it averages only one office action per patent application, which law firm is “better” than the other? Most clients would agree that the best law firms are both effective and efficient, but patent statistics without context fail to paint a clear picture of either of those characteristics.
Instead of relying solely on patent statistics as testaments to a law firm’s effectiveness and efficiency, prospective clients should also consider the fact that one law firm may have frequently faced patent examiners who are much more difficult than those faced by another law firm. After all, there is great variability among USPTO patent examiners—half of all patents are granted by a group of patent examiners making up only 10% of the USPTO examiner pool, and another group of patent examiners making up around 20% of the examiner pool can be credited with less than 1% of patent applications filed with the USPTO each year. For this reason, it may be the case that some law firms with less-than-ideal patent statistics may have been both effective and efficient in prosecuting their patent applications, but this is only apparent once the difficulty of their assigned USPTO patent examiners is taken into account. Likewise, the opposite may be true for a law firm that achieved a high patent allowance rate by facing more applicant-friendly patent examiners. Law firm patent statistics are relative to a firm’s circumstances against the USPTO, which is why they offer little proof that one firm is superior to another.
Market your firm to its fullest potential
You can now market your firm to its fullest potential and win new business from prospective and current clients with credible, third-party, objective data. You have the ability to showcase your areas of expertise with the proprietary Business Development & Analysis reports available through LexisNexis PatentAdvisor® and based on the PatentAdvisor™ Efficiency Score.
PatentAdvisor is a powerful patent analytics tool with the potential to revolutionize your firm’s prosecution practice. The PatentAdvisor service can be used for anything from a quick check into an examiner’s behavior tendencies to deep dives into obscure patent data questions. One important feature of the PatentAdvisor suite of tools is the exclusive Business Development & Analysis reports that can help you better understand your firm’s performance and how it stacks up to the competition.
You can easily and objectively compare prosecution outcomes with highly accurate prosecution performance metrics. The Business Development & Analysis reports provide reliable comparisons of law firms and corporations that can be shared with prospective and current clients. By taking examiner difficulty out of the equation and scoring purely for efficiency, the proprietary PatentAdvisor Efficiency Score enables objective prosecution performance comparisons.
Win new business with Business Development & Analysis reports
The real-time, fully customizable Business Development & Analysis reports provide reliable comparisons of law firms and corporations by taking examiner difficulty out of the equation and scoring purely for efficiency with the proprietary PatentAdvisor™ Efficiency Score.
The Business Development & Analysis reports allow for two types of comparisons.
- With the outside counsel report, you can easily compare how different law firms are performing for the same company.
- The competitive analysis report enables you to quickly see how different law firms/corporations compare to each other in a particular technology area.
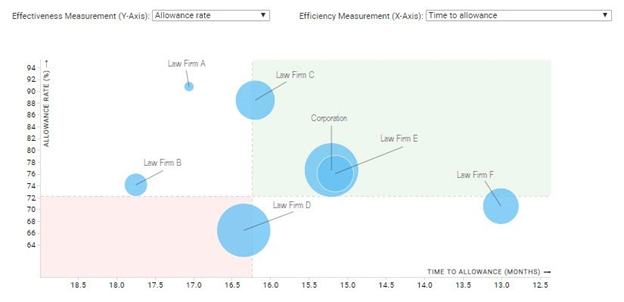
You can easily generate charts and share them with prospective and current clients. The efficiency chart visualization enables you to demonstrate to clients how your firm compares to the competition. The most effective and efficient law firms are found in the top right corner. This type of objective information can make a powerful statement to current or prospective clients. Inclusion in your presentations allows you to market your firm to its fullest potential and win new business.
To enable you to get to an even deeper level of detail and insight, there are additional charts you can generate based on specific prosecution actions, such as the average number of office actions to issuance, the percent of patented applications with at least one Request for Continued Examination (RCE), and time to allowance. These are all methods to objectively demonstrate your firm’s achievements to win new business with current or prospective clients.
The advanced patent metric that helps win new business
The foundation of the Business Development & Analysis reports is the PatentAdvisor Efficiency Score, a proprietary metric designed to overcome the issue of examiner difficulty variability. All the metrics previously used to measure corporate and law firm prosecution performance suffer from the same deficiency: they are highly dependent on the difficulty of the assigned examiner. At the extremes, this is obvious and expected. Everyone expects a law firm working primarily on software applications to have a lower allowance rate than one focusing on medical devices. However, examiner behavior can vary drastically even within a single art unit, meaning that a few rounds of bad luck could significantly affect a law firm’s statistics.
This problem applies to all the most popular industry metrics for prosecution performance: allowance rate, time to allowance, number of actions to allowance, percent of cases with a Request for Continued Examination (RCE), etc. But the primary measure of a law firm or corporation’s prosecution performance—allowance rate—has even more problems.
A more sophisticated patent metric was needed to appropriately compare one law firm to another—one that takes into account the circumstances surrounding a law firm’s success or failure as suggested by its USPTO patent statistics. Fortunately, the PatentAdvisor Efficiency Score offers a solution. A law firm’s Efficiency Score is a more accurate representation of the law firm’s effectiveness and efficiency at the USPTO because it has been normalized for both the difficulty of the patent examiners faced by a law firm and the total number of applications they have prosecuted. Law firms now have more reliable proof that they are better than the rest and can leverage their Efficiency Score to win new business.
Unlike allowance rate, the PatentAdvisor Efficiency Score is:
- Normalized for examiner difficulty
- Normalized for the number of applications
- Not directly penalized for abandonments
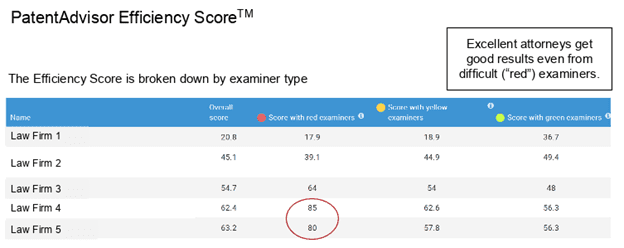
Some patent examiners are more difficult than others. We created the PatentAdvisor Efficiency Score to take examiner difficulty out of the equation. We ranked every patented and abandoned application in our system for efficiency, based on different standards for red (difficult), yellow (average), and green (easy) examiners.
Based on their application scores, each law firm and corporation will receive:
- A red examiner score
- A green examiner score
- A yellow examiner score
- An overall score that is a weighted average of their red, green, and yellow scores
The score ranges from 0 to 100, with the average being 50.
There are many factors at play to win new business from new or existing clients. You can now objectively demonstrate your firm’s successes and communicate that information to new or existing clients in an easy-to-understand way. This can also open a path to developing strategic opportunities and becoming a business partner versus conducting transactional relationships.

Need more predictability in the patent prosecution process?
Learn how to develop successful IP strategies and proficiently manage patent applications throughout the entire prosecution process using data-driven insights and advanced analytics.


