e-Mobility Technology: A final Look at the Top Patent Owners

Sarbani Chattopadhyah
October 29, 2019
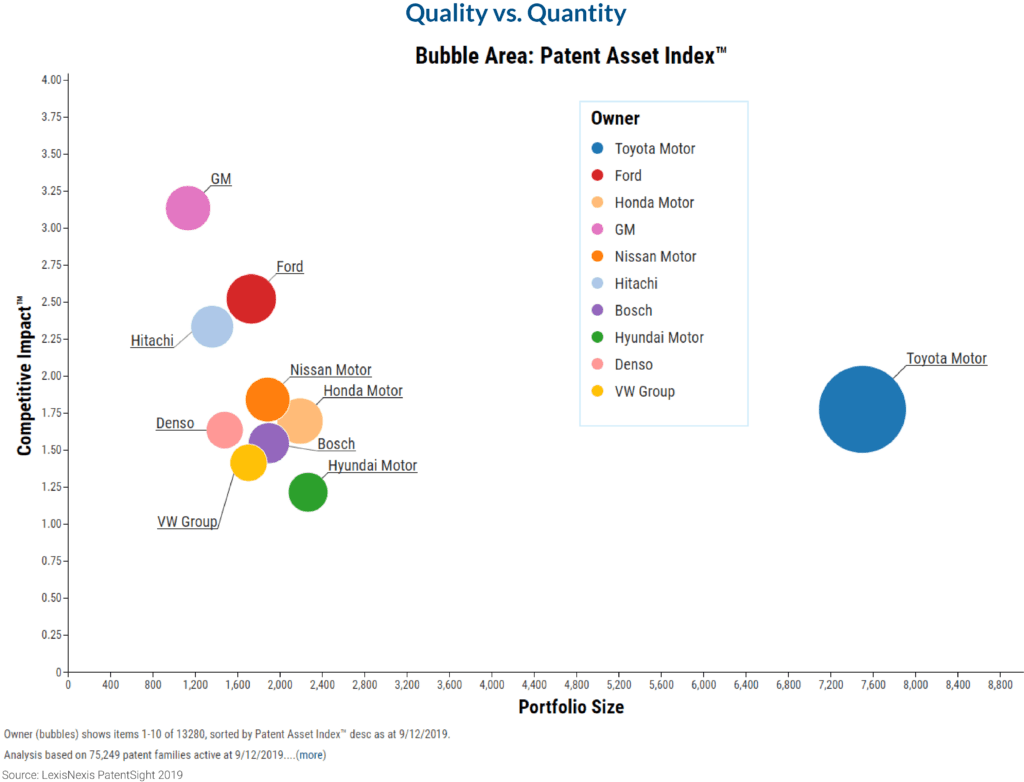
In this final e-mobility technology update, along with sharing some more LexisNexis® PatentSight® findings about our analysis of the electric mobility industry, we also decided to show off some more of our software’s data visualization capabilities. The charts below depict the portfolio trends and strengths of the Top 20 players in e-mobility technology from various qualitative and quantitative perspectives. For example in the Quantity vs. Quality Chart you can see how the current portfolios of these top players match against each other. Whereas, on the Patent Asset Index trend chart we see how their portfolios have evolved, in terms of overall quality, over the past decades. We conclude this deep-dive into ‘e-Mobility’ with a bonus section which gives you a sneak peek into one of our award-winning software’s coolest features.
Comparison of portfolio size trends of the top 20 patent owners in e-mobility
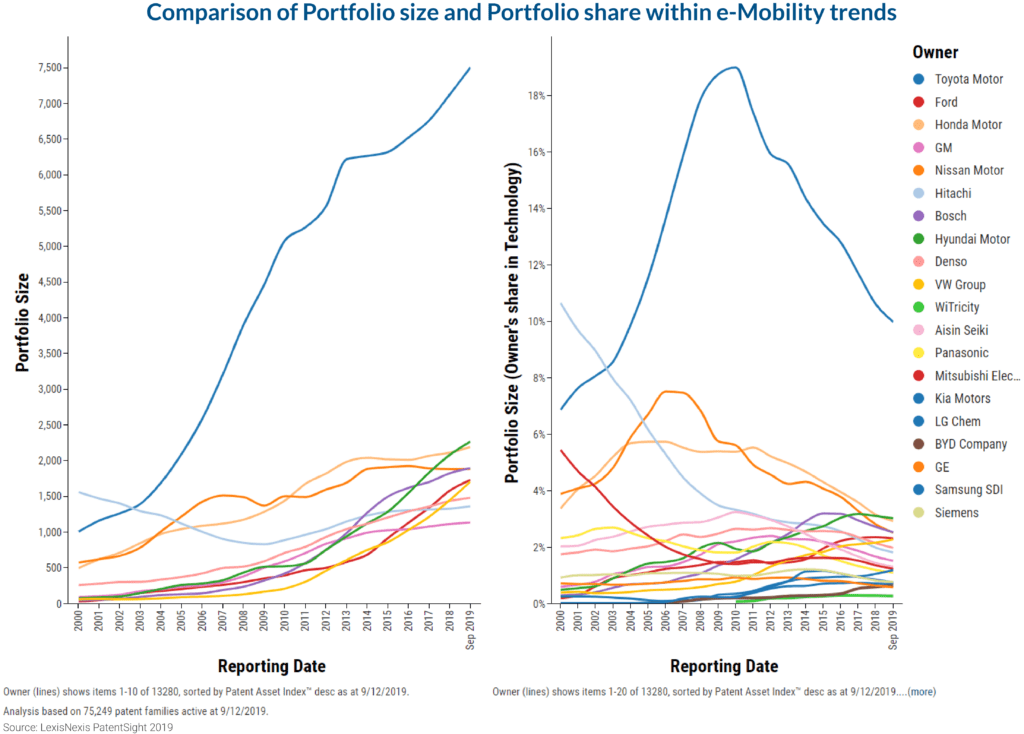
With the previous ranking in mind, we look at the same group of players first using Portfolio Size as the dependent variable and then using each owner’s share of portfolio within the technology as the dependent variable. The graphs that were generated thus, helps in differentiating between absolute portfolio growth and at the same time gives us an overview of the current share of patents in this technology that each of them own.
The one company which exhibits a considerably strong portfolio is, quite visibly, Toyota Motors. They have been steadily increasing patenting in this technology since the early 2000’s. Their lead, in absolute number of patents owned in this field, is beyond the reach of any of the remaining companies on this list. This is also most likely reason why Toyota has had a hybrid car as part of their product range, much earlier than any of their competition. In their communication around the history of their once flagship hybrid car, the Prius, Toyota proudly mentions its patents that were associated with developing the car.
At the same time when looking at the Portfolio share graph it becomes clear that Toyota’s share in e-mobility technology has been reducing heavily and steadily during this past decade. This is evidence that there has been an increase in patenting in this field by new entrants into this technology. Firms operating in this market needs to closely watch the portfolio developments of their competitors and be alert about new entrants, to adjust their strategies accordingly.

Patent Asset Index trends of the top 20 patent owners in e-mobility technology
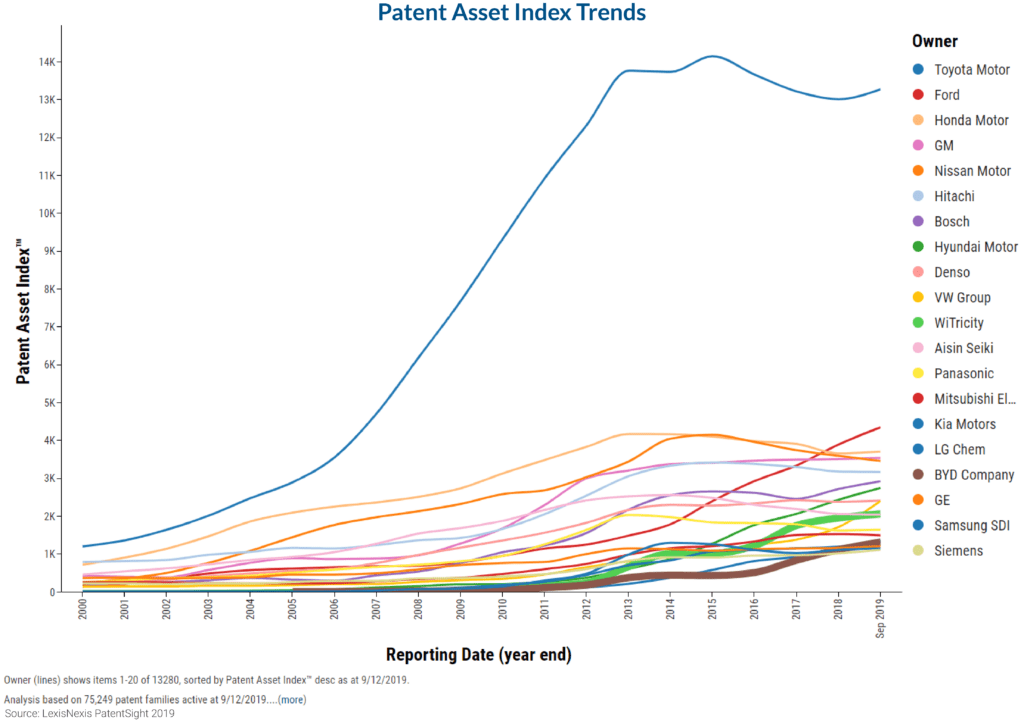
Let’s go ahead and take a look at the Patent Asset Index trends exhibited by the top patent portfolios in this technology. Here, we have used a line chart template from our software to study this trend. Patent Asset Index measures the overall strength of a portfolio. In this case Toyota seems to be the one who owns a formidably strong portfolio in e-Mobility. We would need to perform further analysis on this data to understand more about this portfolio.
Along with these established companies some new players have also entered strongly into the market. Their portfolios have peaked recently, as can be seen from the graphs represented by the thicker lines. These are WiTricity(US) and BYD Company (CN), a developer of wireless charging technologies and a Chinese automaker respectively. Both of them are fairly new entrants to this market and in a short span of time have cultivated a portfolio of good quality patents.

Comparing the top 20 firms based on average portfolio quality
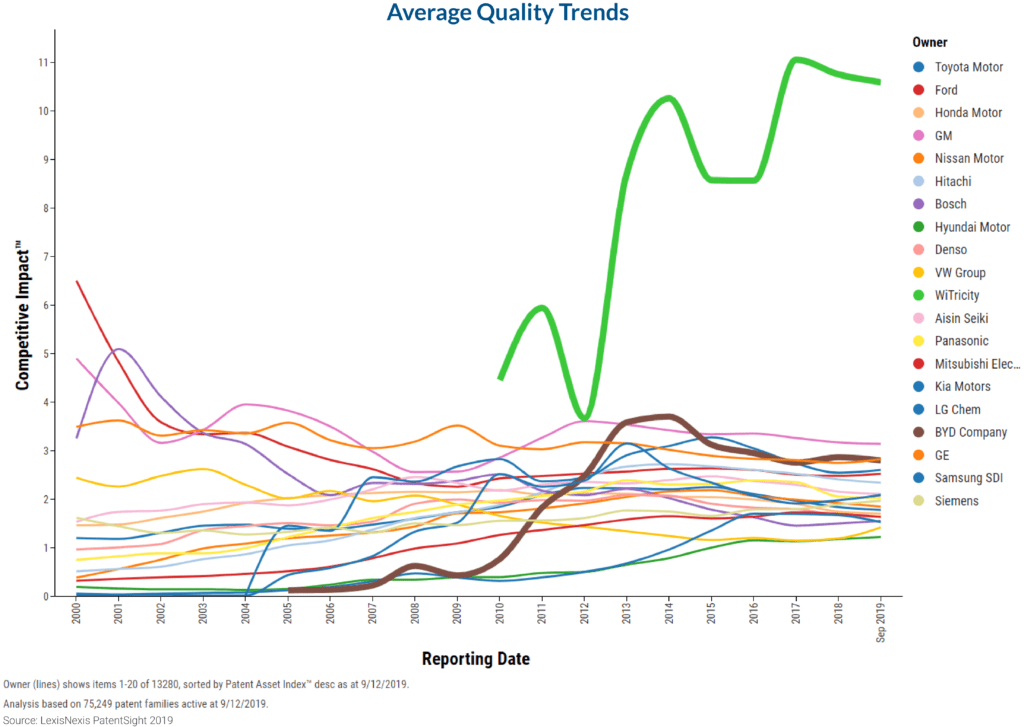
The best part about working with a software that gives you 360ᵒ flexibility of analysis, is that we can now look at these portfolios from purely a qualitative view and exclude the portfolio size from our purview. By selecting Competitive Impact, one of our scientifically proven metrics, it is possible to consider only the average quality of a portfolio. The chart looks entirely different when this selection is made. WiTricity, a company that began patenting since 2010 and is involved in developing contactless charging which could revolutionize the way EV’s are charged, has been developing a very impressive portfolio. Their portfolio, as of writing this blog, has received a Competitive Impact value of 10.6. For comparison, the average Competitive Impact of all the patent families in our database is 1. In plain words, this means, their patents are of considerably higher quality than the average patent in our database.

Quality vs. quantity of portfolios of the top 10 e-mobility patent owners
We use one of our most commonly used and widely loved comparative chart which compares a portfolio’s Competitive Impact vs its Portfolio size. This provides us a view of how these companies fare against each other both qualitatively and quantitatively.

Analyzing portfolio developments over time – video graphs
Now let’s look at one of the most coolest features of our software (yet). This feature was created to bridge the gap in visualizing complex data that involves more than three variables. The usual Line, Bar and Bubble charts, although contain a vast amount of data and visualizes it in a format that is easily understood and compared, have limitations when it comes to accurately depict the development of a portfolio over time. The ‘Time Slider’ feature in our business intelligence software was created exactly for this purpose. By including this feature in an analysis, we are able to create a playable and downloadable animation that shows how the portfolios developed over time.
Play the video below to see how the portfolios of these top innovators in the field of e-Mobility evolved from what they were as of Dec 31st 2000 to the present day.
Access all of the articles in our e-mobility series:
- e-Mobility – Watch Out Traditional OEM’s!
- e-Mobility – Why is Knowing the Legal Status of Patents Important?
- e-Mobility Technology – Who Owns the Strongest Patent Portfolio?
- e-Mobility Technology – Who’s Making It vs. Who’s Buying It?
- e-Mobility Technology – How to Predict the Portfolio of Your Competition
Learn more about PatentSight and the Patent Asset Index.
About the author: Dr. Sarbani Chattopadhyay
As a consultant, Sarbani assists clients in using PatentSight in the most optimal way, so that they get insights about patents, about their own portfolio, and portfolios of their competitors, and technologies they are working with, as well as which other technologies are being influenced by their inventions.
